Probability-Probability plots#
This notebook includes code to reproduce Figure 4 and Figures B1-3 which all show P-P plots for the different samplers and combinations of detectors.
We use a function from gw_smc_utils to produce the P-P plots from the saved credible levels rather than recomputing them.
Imports#
Import the various modules we need. We also set the plotting style using
a function gw_smc_utils.
from pathlib import Path
from gw_smc_utils.plotting import set_style, pp_plot_from_credible_levels
import pandas as pd
import matplotlib.pyplot as plt
import re

set_style()

Path("figures").mkdir(exist_ok=True)
Data release path#
Specify the path to the data release and directory with the pre-computed credible levels.
data_release_path = Path("../data_release/gw_smc_data_release_core/")
credible_levels_path = (
    data_release_path / "simulated_data" / "pp_tests" / "credible_levels"
)
Parameters to plot#
We specify which parameters to include in the P-P plot.
keys = [
    "chirp_mass",
    "mass_ratio",
    "a_1",
    "a_2",
    "tilt_1",
    "tilt_2",
    "phi_12",
    "phi_jl",
    "luminosity_distance",
    "dec",
    "ra",
    "theta_jn",
    "psi",
    "geocent_time",
    "phase",
]
P-P plots#
We then produce all four P-P plots for dynesty and pocomc.
We use re to determine the sampler and number of detectors from the name of the file.
credible_level_files = sorted(credible_levels_path.glob("*.hdf5"))
for clf in credible_level_files:
    sampler = re.search(r"(dynesty|pocomc)", clf.name).group(0)
    ndet = re.search(r"(\d+)det", clf.name).group(0)
    print(f"\nProducing P-P plot for {sampler} in {ndet}")
    if not sampler or not ndet:
        raise ValueError(f"Could not extract sampler or ndet from {clf.name}")
    credible_levels = pd.read_hdf(clf, "credible_levels")
    fig, pvalues = pp_plot_from_credible_levels(
        credible_levels,
    )
    fig.savefig(f"figures/pp_test_{sampler}_{ndet}.pdf")
    plt.show()
Producing P-P plot for dynesty in 2det
Key: KS-test p-value
chirp_mass: 0.7771517937934718
mass_ratio: 0.5445615251665072
a_1: 0.4403188188955085
a_2: 0.6122308537565916
tilt_1: 0.5719255436590474
tilt_2: 0.11311976018286991
phi_12: 0.2551949245099298
phi_jl: 0.4459980013748712
luminosity_distance: 0.3758418625879959
dec: 0.4659357219669866
ra: 0.6365339663820636
theta_jn: 0.33080004478357095
psi: 0.4046471593038901
geocent_time: 0.5700512799180151
phase: 0.020902793779779567
Combined p-value: 0.39431058118709594

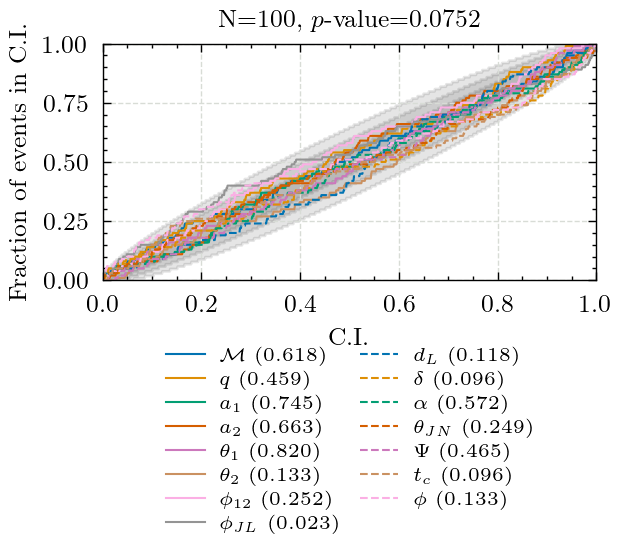
Producing P-P plot for dynesty in 3det
Key: KS-test p-value
chirp_mass: 0.6183234174544158
mass_ratio: 0.45889144129001747
a_1: 0.7449683487717833
a_2: 0.6629527248267517
tilt_1: 0.8195268629036007
tilt_2: 0.13264787632526207
phi_12: 0.2521499836450055
phi_jl: 0.02320656544370816
luminosity_distance: 0.11834318001043882
dec: 0.09597416157896503
ra: 0.5722859992281086
theta_jn: 0.2492071636273997
psi: 0.4647849449322706
geocent_time: 0.09605250274522686
phase: 0.13345165533186798
Combined p-value: 0.07521085892900788
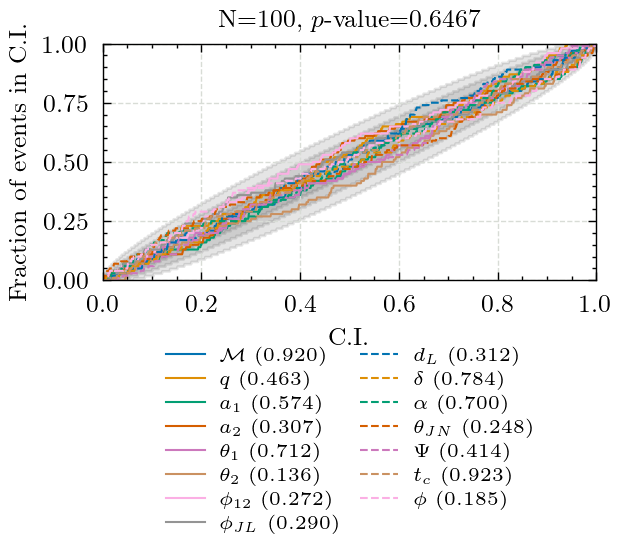
Producing P-P plot for pocomc in 2det
Key: KS-test p-value
chirp_mass: 0.9203853917146985
mass_ratio: 0.46290011380622487
a_1: 0.5740375367396955
a_2: 0.30701407576298106
tilt_1: 0.7121396882605221
tilt_2: 0.13593286253567236
phi_12: 0.27209759730968297
phi_jl: 0.28993837175156373
luminosity_distance: 0.3119068356426094
dec: 0.7839081603001069
ra: 0.6998617213167271
theta_jn: 0.24771077966633723
psi: 0.4143748314512006
geocent_time: 0.9230230724227579
phase: 0.18453084155760371
Combined p-value: 0.6467059189339958
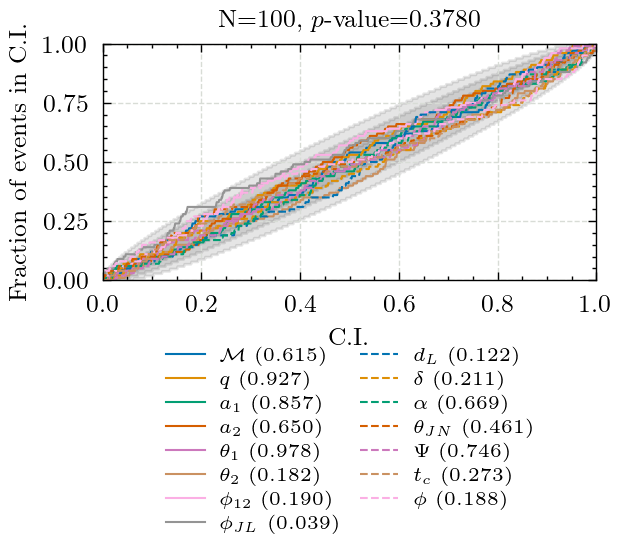
Producing P-P plot for pocomc in 3det
Key: KS-test p-value
chirp_mass: 0.614760438122554
mass_ratio: 0.9271702880706929
a_1: 0.8570354545603031
a_2: 0.6502166206238977
tilt_1: 0.9781344008193242
tilt_2: 0.1823787096961348
phi_12: 0.18982385921439227
phi_jl: 0.03861627507144521
luminosity_distance: 0.12179926113574778
dec: 0.21062003743469473
ra: 0.6693428240072046
theta_jn: 0.46117846150170705
psi: 0.7459144041661957
geocent_time: 0.2727448457407789
phase: 0.18807351610964593
Combined p-value: 0.3780003255278864