BNS Results#
This notebook includes code to produces the figures and tables presented in section 5.2 which covers BNS analyses.
Imports#
Import the various modules we’re going to use.
import json
import re
from collections import defaultdict
from itertools import zip_longest
from pathlib import Path

import h5py
import matplotlib.pyplot as plt
import numpy as np
import pandas as pd
import tabulate
from IPython.display import HTML, display
from matplotlib.lines import Line2D
from pesummary.gw.plots.latex_labels import GWlatex_labels

from gw_smc_utils.plotting import lighten_colour, set_style

set_style()

# There are some issues with plotting when using latex
plt.rcParams["text.usetex"] = False

Path("figures").mkdir(exist_ok=True)
Path("tables").mkdir(exist_ok=True)
Data release paths#
We specify paths to the data release and relevant files.
Change these if you have downloaded the data release to a different path.
data_release_path = Path("../data_release/gw_smc_data_release_core")
bns_results = data_release_path / "simulated_data" / "bns_results"
summary_path = bns_results / "bns_results_summary.hdf5"
Jensen-Shannon Divergence#
Load in the JSD results from the JSON file.
Each JSON file contains the following keys:
{
    "res1": "path to result file 1",
    "res2": "path to result file 2",
    "base": 2,            # Base used in the calculation
    "seed": 1234,         # The random seed
    "n_samples": 5000,    # The number of samples
    "n_tests": 10,        # The number of tests for bootstrapping errors
    "jsd": {
        "chirp_mass": [
            ...
        ],
        "mass_ratio": [
            ...
        ],
        ...
    }
}
jsd_path = bns_results / "jsd_results"

jsd_files = list(jsd_path.glob("*.json"))
if not jsd_files:
    raise FileNotFoundError("No JSD files found in the specified directory.")

dets = ["2det", "3det"]
labels = [
    "aligned_with_tides",
    "aligned_without_tides",
    "precessing_with_tides",
    "precessing_without_tides",
]

jsd_data = {}
for det in dets:
    jsd_data[det] = {}
    for label in labels:
        jsd_data[det][label] = {}
        for jsd_file in jsd_files:
            if det in jsd_file.name and label in jsd_file.name:
                with open(jsd_file, "r") as f:
                    jsd_data[det][label] = json.load(f)
We collate the results into a pandas DataFrame to make handling the results easier.
We take the mean of the JSD values per-parameter.
jsd_df = pd.DataFrame(columns=["ndet", "tides", "spin"])
for det in dets:
    for label in labels:
        dat = {
            "ndet": det[0],
            "tides": False if "without" in label else True,
            "spin": "aligned" if "aligned" in label else "precessing",
        }
        for key, value in jsd_data[det][label]["jsd"].items():
            dat[key] = value
        dat = pd.DataFrame([dat])
        jsd_df = pd.concat([jsd_df, dat], ignore_index=True)
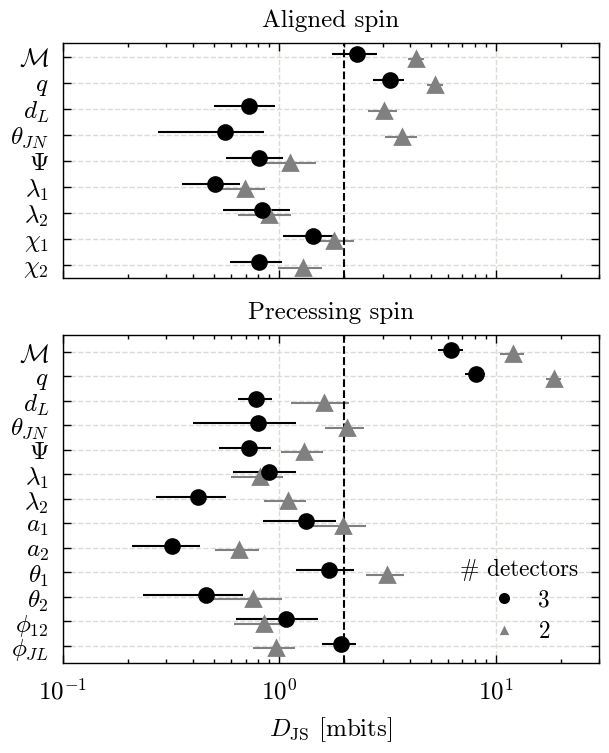
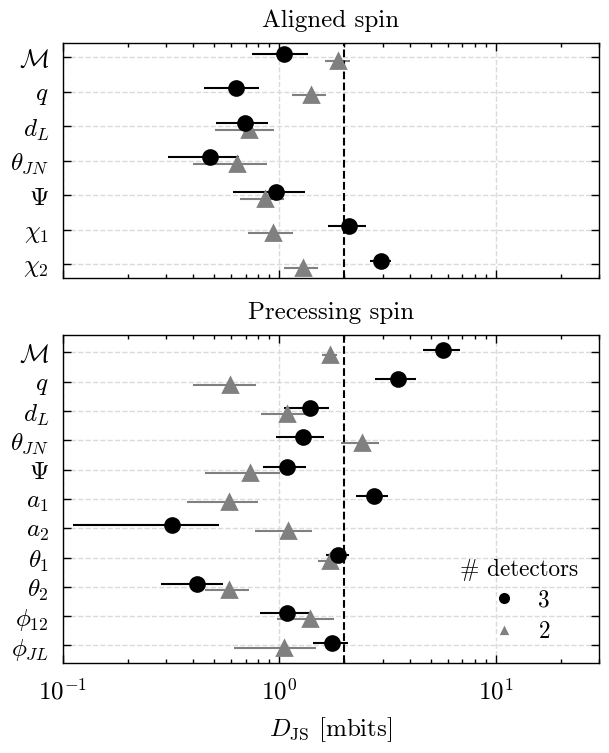
Figures 9 & B4#
We make both figures using the same code and a for loop.
latex_labels = {}

other_gw_labels = {
    "chi_1": "$\\chi_1$",
    "chi_2": "$\\chi_2$",
}

include_tides = [True, False]

for tides in include_tides:
    figsize = plt.rcParams["figure.figsize"].copy()
    figsize[1] = 2 * figsize[1]
    fig, axs = plt.subplots(2, 1, figsize=figsize, sharex=True, height_ratios=[1, 1.4])

    for ax, spin in zip(axs, ["aligned", "precessing"]):
        subset = jsd_df[(jsd_df["spin"] == spin) & (jsd_df["tides"] == tides)]
        all_parameters = subset.columns[3:]
        parameters = all_parameters[~subset[all_parameters].isna().all()]
        for p in parameters:
            label = GWlatex_labels.get(p, other_gw_labels.get(p, p))
            label = re.sub(r"\[.*?\]", "", label)
            latex_labels[p] = label
        yticks = np.arange(len(parameters))[::-1]
        yoffset = 0.2

        for j, ndet in enumerate([2, 3]):
            df = jsd_df[jsd_df["spin"] == spin]
            df = df[df["tides"] == tides]
            df = df[df["ndet"] == str(ndet)]
            for i, p in enumerate(parameters):
                data = 1000 * np.clip(np.array(df[p].values[0]), 0, 1)
                mean = data.mean()
                std = data.std()
                offset = yoffset * (j - 0.5)
                if spin == "aligned":
                    colour = "k"
                else:
                    colour = "k"
                if ndet == 2:
                    colour = lighten_colour(colour, 0.5)
                    marker = "^"
                else:
                    marker = "o"
                ax.errorbar(
                    mean,
                    yticks[i] + offset,
                    xerr=std,
                    fmt=marker,
                    label=latex_labels[p],
                    c=colour,
                )
            ax.set_xscale("log")
            ax.set_yticks(yticks)
            # Disable minor ticks
            ax.set_yticks([], minor=True)
            ax.set_yticklabels([latex_labels[p] for p in parameters])

    axs[0].set_title("Aligned spin")
    axs[1].set_title("Precessing spin")

    for ax in axs:
        ax.axvline(2, color="k", ls="--")
        ax.set_xlim(0.1, 30)

    legend_handles = [
        Line2D(
            [0],
            [0],
            marker="o",
            color="w",
            markerfacecolor="k",
            markersize=5,
            label="3",
            ls="",
        ),
        Line2D(
            [0],
            [0],
            marker="^",
            color="w",
            markerfacecolor=lighten_colour("k", 0.5),
            markersize=5,
            label="2",
            ls="",
        ),
    ]

    axs[1].legend(
        handles=legend_handles,
        loc="lower right",
        fontsize="small",
        title="# detectors",
        title_fontsize="small",
    )

    axs[-1].set_xlabel(r"$D_{\rm JS}$ [mbits]")
    filename = f"bns_jsd_{'with' if tides else 'without'}_tides.pdf"
    fig.savefig(f"figures/{filename}", bbox_inches="tight")
    plt.show()
Run statistics - Tables 1 & B1#
Load the data from the summary file.
data = {}
with h5py.File(summary_path, "r") as f:
    for sampler in f.keys():
        data[sampler] = {}
        for ndetector in f[sampler].keys():
            data[sampler][ndetector] = {}
            for key in f[sampler][ndetector].keys():
                data[sampler][ndetector][key] = {}
                for stat in f[sampler][ndetector][key].keys():
                    data[sampler][ndetector][key][stat] = f[sampler][ndetector][key][
                        stat
                    ][:]
Comparison to dynesty#
We compare the efficiency between the two samplers
samplers = list(data.keys())
ndets = list(data[samplers[0]].keys())

# Ratio of dynesty to pocomc for number of likelihood evaluations per sample

for ndetector in ndets:
    for key in data[samplers[0]][ndetector]:
        val0 = (
            data[samplers[0]][ndetector][key]["likelihood_evaluations"]
            / data[samplers[0]][ndetector][key]["n_samples"]
        )
        val1 = (
            data[samplers[1]][ndetector][key]["likelihood_evaluations"]
            / data[samplers[1]][ndetector][key]["n_samples"]
        )
        ratio = np.mean(val0) / np.mean(val1)
        print(f"{ndetector} {key} ratio: {ratio:.2f}")
2det aligned_with_tides ratio: 5.47
2det aligned_without_tides ratio: 10.06
2det precessing_with_tides ratio: 1.95
2det precessing_without_tides ratio: 3.14
3det aligned_with_tides ratio: 5.87
3det aligned_without_tides ratio: 12.33
3det precessing_with_tides ratio: 2.11
3det precessing_without_tides ratio: 2.97
Formatting the data#
Reformat the data into rows for the table.
This includes taking the mean of the run statistics.
rows = []

for sampler, sampler_data in data.items():
    for det, det_data in sampler_data.items():
        for key, key_data in det_data.items():
            if "precessing" in key.lower():
                precessing = True
            else:
                precessing = False
            if "with_tides" in key.lower():
                tides = True
            else:
                tides = False
            rows.append(
                {
                    "sampler": sampler,
                    "det": det,
                    "key": key,
                    "tides": tides,
                    "precessing": precessing,
                    "likelihood_evaluations": float(
                        np.mean(key_data["likelihood_evaluations"])
                    ),
                    "sampling_time": float(np.mean(key_data["sampling_time"] / 60)),
                    "likelihood_evaluations_per_sample": float(
                        np.mean(
                            key_data["likelihood_evaluations"] / key_data["n_samples"]
                        )
                    ),
                    "sampling_time_per_sample": float(
                        np.mean(key_data["sampling_time"] / 60 / key_data["n_samples"])
                    ),
                }
            )


df = pd.DataFrame(rows)

# Define group order
# Order: (precessing, tides)
group_order = [
    (False, False),
    (False, True),
    (True, False),
    (True, True),
]


# Helper to interleave rows
def interleave_group(group_df):
    grouped = [
        g[1].sort_values("det").to_dict(orient="records")
        for g in group_df.groupby("sampler")
    ]
    interleaved = []
    for row_group in zip_longest(*grouped):
        interleaved.extend(r for r in row_group if r is not None)
    return interleaved


# Process all groups and interleave
final_rows = []
for precessing, tides in group_order:
    group_df = df[(df["precessing"] == precessing) & (df["tides"] == tides)]
    final_rows.extend(interleave_group(group_df))
HTML Table#
Below, the tabled is visualized in HTML using the tabulate package.
html_table = tabulate.tabulate(final_rows, headers="keys", tablefmt="html")
display(HTML(html_table))
| sampler | det | key | tides | precessing | likelihood_evaluations | sampling_time | likelihood_evaluations_per_sample | sampling_time_per_sample |
|---|---|---|---|---|---|---|---|---|
| dynesty | 2det | aligned_without_tides | False | False | 3.70063e+07 | 199.647 | 7530.13 | 0.0406215 |
| pocomc | 2det | aligned_without_tides | False | False | 3.0755e+06 | 23.7154 | 748.646 | 0.00577309 |
| dynesty | 3det | aligned_without_tides | False | False | 3.32848e+07 | 167.326 | 7273.28 | 0.0365777 |
| pocomc | 3det | aligned_without_tides | False | False | 2.39225e+06 | 34.9858 | 589.681 | 0.00871153 |
| dynesty | 2det | aligned_with_tides | True | False | 2.9891e+07 | 181.365 | 5479.18 | 0.0332435 |
| pocomc | 2det | aligned_with_tides | True | False | 4.21025e+06 | 35.7803 | 1002.25 | 0.00851231 |
| dynesty | 3det | aligned_with_tides | True | False | 3.78867e+07 | 295.931 | 6686.32 | 0.0520885 |
| pocomc | 3det | aligned_with_tides | True | False | 4.518e+06 | 34.2139 | 1139.58 | 0.00862485 |
| dynesty | 2det | precessing_without_tides | False | True | 2.94294e+07 | 129.721 | 5941.8 | 0.0261922 |
| pocomc | 2det | precessing_without_tides | False | True | 6.31048e+06 | 43.7491 | 1895.31 | 0.0131671 |
| dynesty | 3det | precessing_without_tides | False | True | 4.11257e+07 | 303.005 | 7173.85 | 0.0528544 |
| pocomc | 3det | precessing_without_tides | False | True | 1.87365e+07 | 272.752 | 2417.02 | 0.0349982 |
| dynesty | 2det | precessing_with_tides | True | True | 2.52399e+07 | 169.877 | 4660.23 | 0.0313742 |
| pocomc | 2det | precessing_with_tides | True | True | 1.80425e+07 | 143.586 | 2389.23 | 0.0190107 |
| dynesty | 3det | precessing_with_tides | True | True | 3.28534e+07 | 346.132 | 5394.8 | 0.0566086 |
| pocomc | 3det | precessing_with_tides | True | True | 1.98465e+07 | 153.395 | 2556.12 | 0.0198097 |
Latex tables#
We then generate the latex tables for the paper.
These are written to files in the tables directory.
table_data = defaultdict(
    lambda: defaultdict(lambda: defaultdict(lambda: defaultdict(list)))
)

for ndet in [2, 3]:
    data = []
    for row in final_rows:
        if row["det"] == f"{ndet}det":
            continue
        else:
            data.append(row)

    def format_sci_latex(x, precision=2):
        """Format number in LaTeX-style scientific notation."""
        if x == 0:
            return f"${0:.{precision}f}$"
        exponent = int(np.floor(np.log10(abs(x))))
        mantissa = x / (10**exponent)
        return f"${mantissa:.{precision}f} \\times 10^{{{exponent}}}$"

    # Function to format a row (can average if needed)
    def format_cell(entry, keys):
        if not entry:
            return ["--"] * len(keys)
        out = []
        for key in keys:
            v = entry[key]
            if key == "likelihood_evaluations":
                out.append(format_sci_latex(v, 1))
            elif key == "sampler":
                out.append(r"\texttt{" + v + "}")
            elif isinstance(v, float):
                out.append(f"{v:.4g}")
            elif isinstance(v, bool):
                if v:
                    out.append(r"\cmark")
                else:
                    out.append(r"\xmark")

            else:
                out.append(str(v))
        return out

    # Build LaTeX table
    header = r"""
    \begin{tabular}{lcccccc}
    \toprule
    Sampler & Precession & Tides & Likelihood evaluations & Wall time [min] & Likelihood evaluations per sample \\
    \midrule
    """

    latex_rows = []
    for r in data:
        row = format_cell(
            r,
            keys=[
                "sampler",
                "precessing",
                "tides",
                "likelihood_evaluations",
                "sampling_time",
                "likelihood_evaluations_per_sample",
            ],
        )
        if r["sampler"] == "dynesty":
            latex_rows.append(r"\rowcolor{lightgrey}" + " & ".join(row) + r" \\")
        else:
            latex_rows.append(" & ".join(row) + r" \\")

    footer = r"""
    \bottomrule
    \end{tabular}
    """

    latex_table = header + "\n".join(latex_rows) + footer

    with open(
        f"tables/bns_sampling_time_vs_likelihood_evaluations_{ndet}det.tex", "w"
    ) as f:
        f.write(latex_table)